Hematological Malignancy Research


Overcoming Challenges in Hematological Malignancy Research
Current workflows for AML, MDS, and related hematological malignancies rely on a combination of technologies, each contributing different information. Integrating findings across multiple reports adds complexity, and critical variant classes remain difficult to resolve:
- Short-read sequencing: Designed primarily to detect SNPs and indels; therefore, it is likely to miss SVs and CNVs in key heme-relevant genes and highly repetitive regions.
- Long-read sequencing: Expensive and subject to sequencing artifacts, with challenges in comprehensively resolving highly complex genomic rearrangements.
- Karyotyping: Limited to very large-scale events
- Fluorescence hybridization (FISH): Targeted and low resolution; often identifies the presence of a rearrangement without identifying the fusion partner
- Chromosomal microarray analysis: Limited resolution; cannot detect balanced translocations or inversions
See SV and CNV Classes across Hematological Malignancies
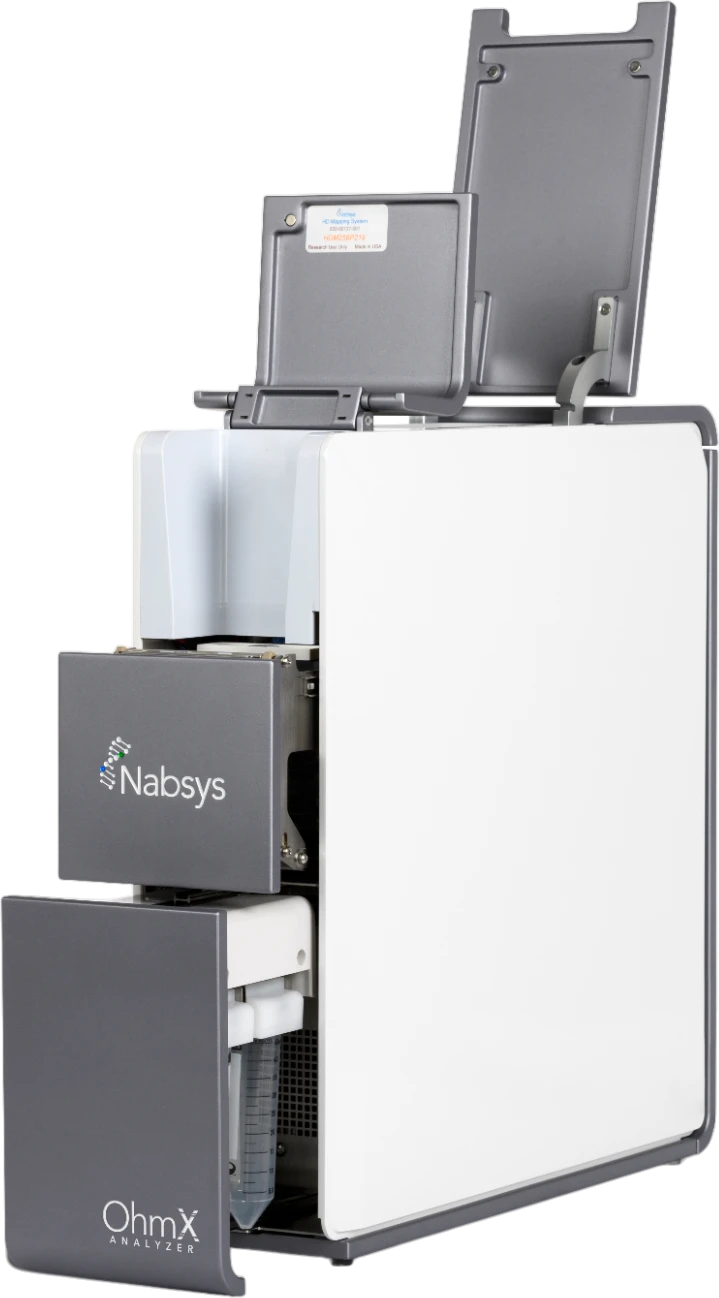
EGM using the OhmX™ Platform provides a novel view of the genome. The OhmX Platform empowers researchers with a comprehensive picture of genomic variation—including critical and often undetected SVs alongside genome-wide copy number profiling—in both somatic and germline samples.
Deletion — TP53
TP53—a critical tumor suppressor gene—is among the most frequently altered genes in hematological malignancy research. Both large and small homozygous TP53 deletions were characterized in cancer cell line samples using the OhmX Platform, including a deletion as small as 3.8 kb.
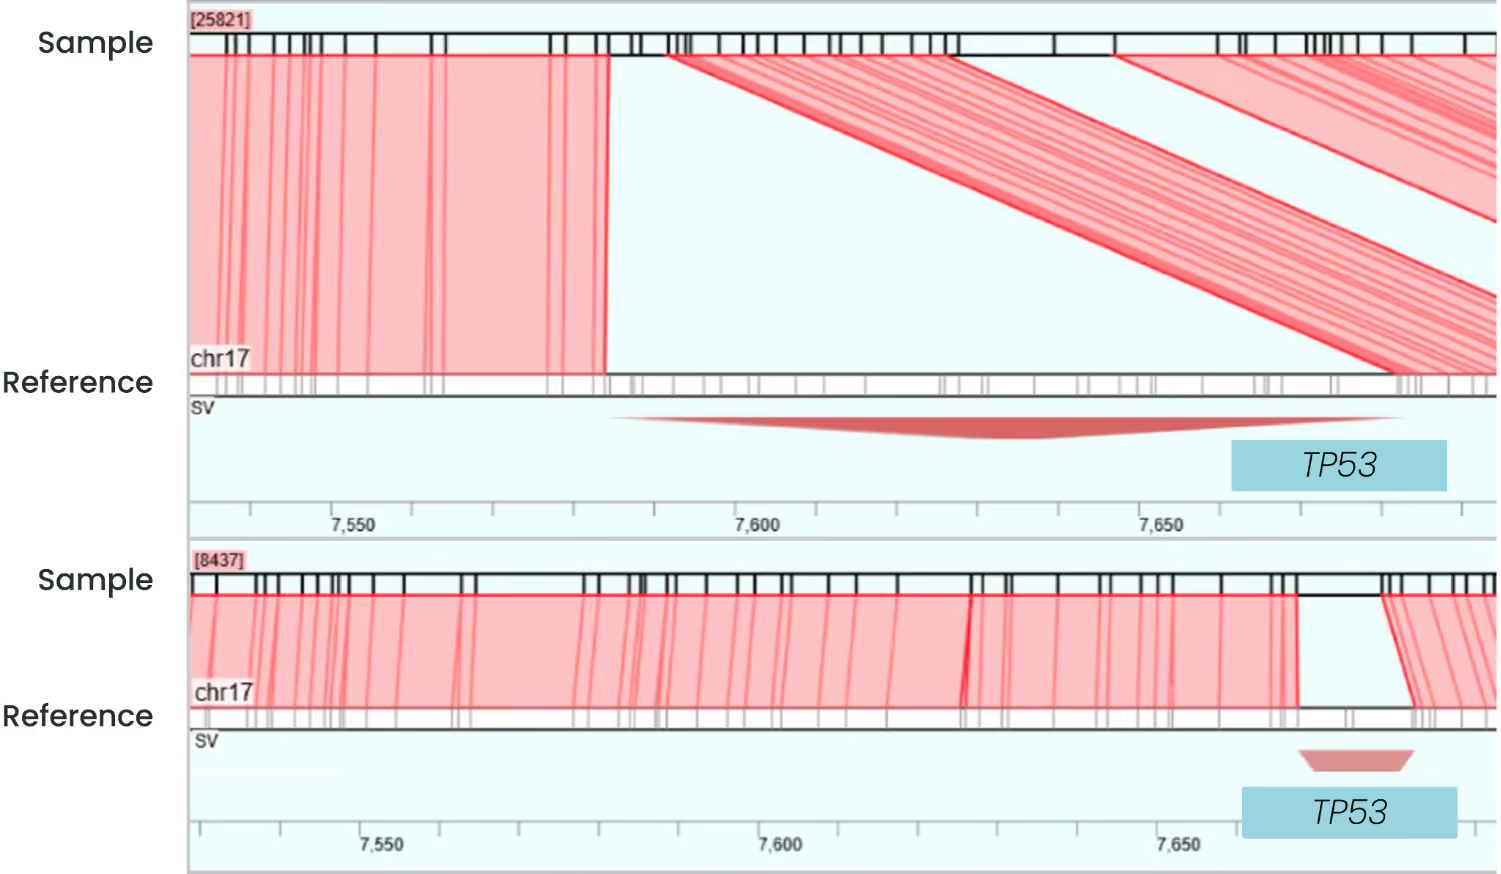
Figure 2. TP53 deletions in cancer cell line samples visualized in Human Chromosome Explorer® (HCE). (Top) In the HL-60 leukemia cell line, the Allele 1 track aligns to chromosome 17 with EGM tag spacings consistent with a large 87 kb TP53 deletion. (Bottom) In the H1299 cell line, the Allele 1 track shows EGM tag spacings consistent with a small 3.8 kb TP53 deletion overlapping exons 7 and 8. TP53 genes and deletions are represented as teal rectangles and red trapezoids, respectively.
KMT2A Partial Tandem Duplication
KMT2A partial tandem duplications (KMT2A-PTD) are cryptic structural variants found in approximately 5–10% of AML cases. This family of duplications—where both breakpoint architecture and allelic dosage influence biology—is difficult to characterize using standard cytogenetic methods. A 22 kb KMT2A-PTD was characterized in an EOL-1 AML cell line using EGM.
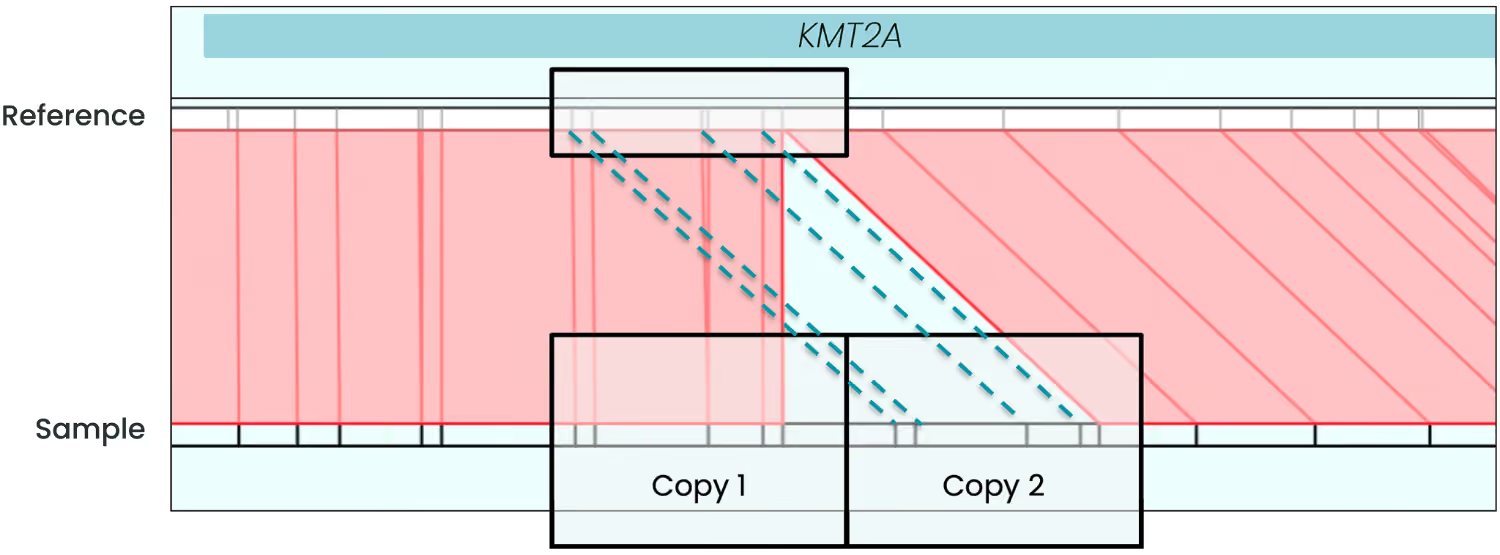
Figure 1. KMT2A partial tandem duplication (PTD) in an AML cell line (EOL-1) visualized in Human Chromosome Explorer® (HCE). In the reference contig (top), a single copy of the duplicated segment is present. In the sample contig (bottom), Copy 1 and Copy 2 each align back to the same reference interval (dashed lines), indicating a 22 kb tandem duplication at the KMT2A locus.
Inversion — inv(3)(q21q26)
The paracentric inversion inv(3)(q21q26) is a recurrent structural alteration in hematological malignancy research, typically fusing MECOM with the GATA2 enhancer. Standard of care identifies this event through G-banding karyotyping and confirms it with MECOM dual-color break-apart FISH probes. Using EGM, this inversion was characterized as an inverted, intrachromosomal fusion with little to no CNV loss or gain in the MOLM-1 cell line.
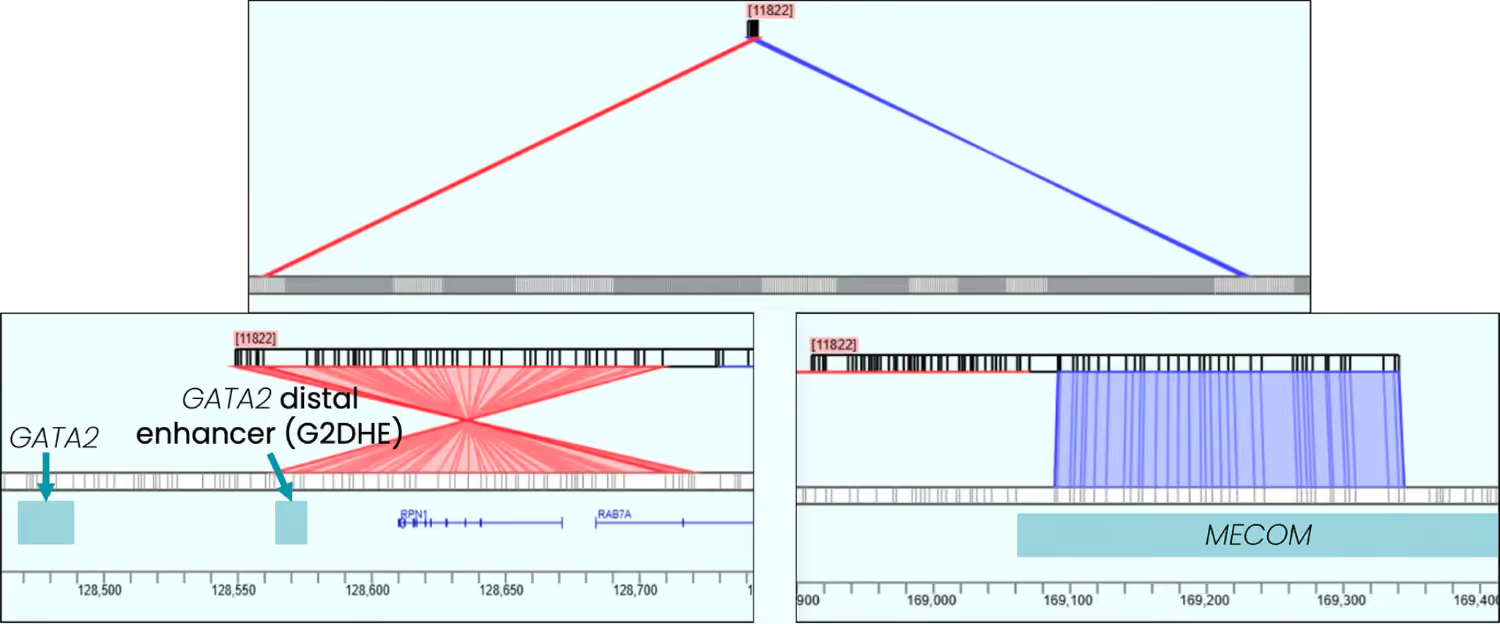
Figure 3. inv(3)(q21q26) inversion in the MOLM-1 cell line visualized in HCE. (Top) Overview of contig spanning chromosome 3, with a V-shaped arc indicating a large rearrangement. (Bottom left) Zoomed view of the left breakpoint at the GATA2 enhancer region; fanning red lines indicate the inverted contig alignment. (Bottom right) Zoomed view of the right breakpoint at the MECOM locus showing concordant forward contig alignment in blue. The rearrangement is consistent with a paracentric inversion involving MECOM and the GATA2 enhancer, with little to no accompanying copy number change.
Translocation — RUNX1::RUNX1T1
The RUNX1::RUNX1T1 fusion resulting from the t(8;21) translocation is a key research marker in AML and is associated with a distinct disease subtype.
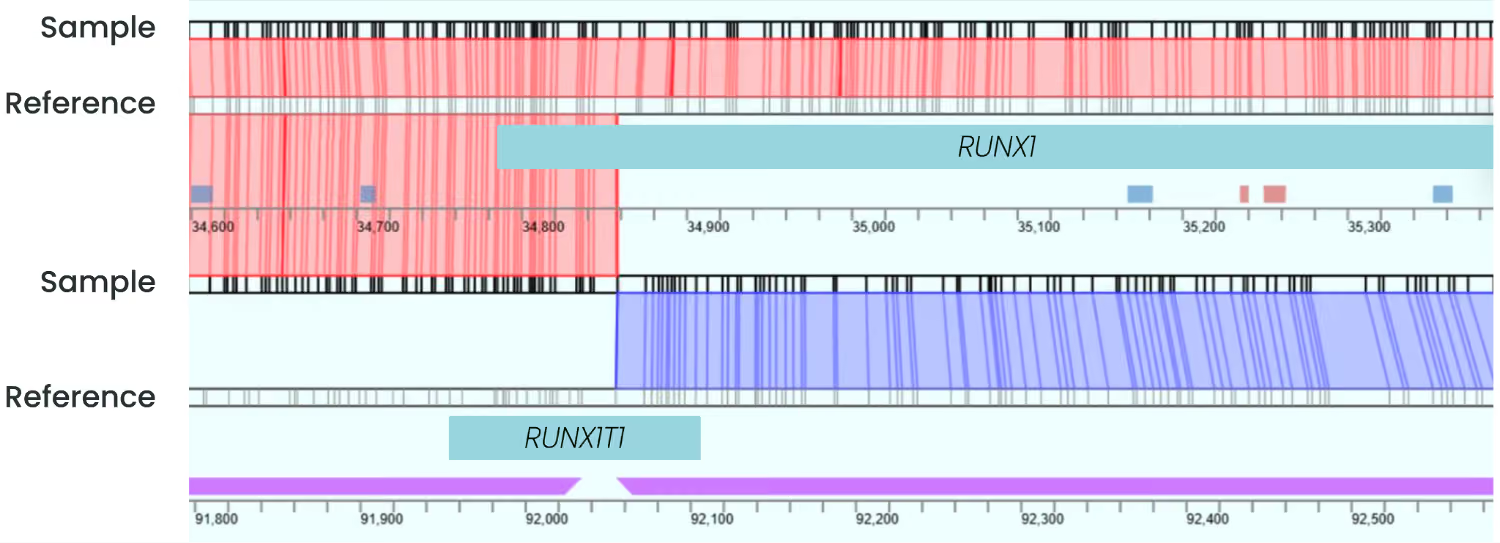
Figure 4. RUNX1::RUNX1T1 fusion in an AML cell line (Kasumi-1) visualized in HCE. The top track (Allele 1) maps to chromosome 21 and represents the unaffected homolog, showing no structural variation. The bottom track (Allele 2) maps to both chr21 and chr8, indicating a translocation in which RUNX1 is fused to RUNX1T1. Genes are represented as teal and green rectangles; translocations are represented as purple trapezoids.
Complex Rearrangement — BCR::ABL1 in K562
Complex genomic rearrangements—defined by three or more breakpoints—are among the most challenging variant classes to resolve with conventional approaches. An ultra-long EGM contig (~4 Mb) captured a complex rearrangement in the K562 CML cell line, revealing fusions spanning chromosomes 9, 13, and 22, concordant with the known structure of this cell line in the literature.
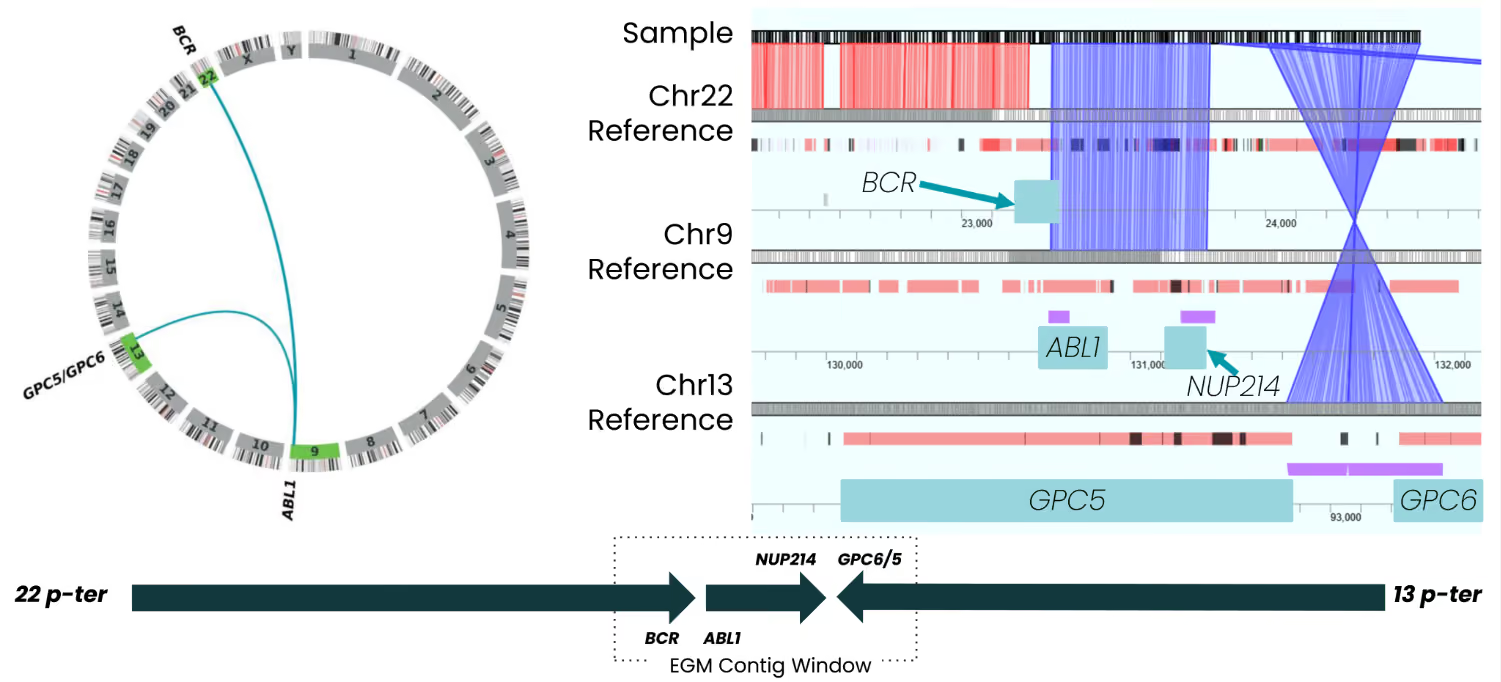
Figure 5. Complex BCR::ABL1 rearrangement in the K562 CML cell line visualized in HCE. (Left) Circos plot illustrating interchromosomal connections among chromosomes 9, 13, and 22. (Right) A single EGM contig maps sequentially through chr22 (BCR), chr9 (ABL1), and chr13 (NUP214, GPC6/5); contig alignments and reference intervals for each chromosome are shown. (Bottom) The EGM contig window displays the reconstructed gene order across the three-chromosome rearrangement, from 22 p-ter through 13 p-ter.1
Genome-Wide Copy Number Variation (CNV) Detection
Copy number gains and losses are hallmarks of hematological malignancy genomes. EGM data can be used for genome-wide copy number profiling, which, when combined with structural variant detection via de novo assembly in Human Chromosome Explorer® (HCE), provides a broad view of genomic alteration patterns across the genome.
%20Detection%20(1).avif)
Figure 6. Genome-wide CNV analysis of EGM data from the MEC-1 cell line. Chromosome-by-chromosome copy number profiles display gains and losses across the genome, consistent with known aberrations in the MEC-1 cell line.
*The CNV pipeline is an exploratory research tool under active development. Pipeline outputs have not been analytically validated and are subject to change.2
Resources

Low-Cost Acquisition Options
Get powerful results without overextending your budget. With zero upfront costs and an 8-genome-per-month commitment, our Reagent Rental Program makes EGM accessible to research labs of all sizes.
Advance Your Hematological Malignancy Research with EGM
The OhmX Platform provides the resolution and coverage to characterize heme-relevant genomic variation. Whether you're investigating known rearrangements or uncovering novel SVs, your lab can access a comprehensive view of SVs and CNVs—within a single whole-genome workflow.
- Luebeck J, Coruh C, Dehkordi SR, et al. AmpliconReconstructor integrates NGS and optical mapping to resolve the complex structures of focal amplifications. Nat Commun. 2020;11(1):4374. doi:10.1038/s41467-020-18099-z
- Stacchini A, Aragno M, Vallario A, et al. MEC1 and MEC2: two new cell lines derived from B-chronic lymphocytic leukaemia in prolymphocytoid transformation. Leuk Res. 1999;23(2):127-136. doi:10.1016/s0145-2126(98)00154-4
Our Products
The state-of-the-art OhmX Platform uses electronic nano-detectors to deliver the highest resolution for whole genome structural variant analysis. You can now perform whole genome analysis of SVs down to 300bp in size—enabling insights into previously undetectable DNA variations.
Learn More